Home / Monitoring & intelligence

CONTINUOUS VISIBILITY. BETTER-INFORMED ACTION.

Connect the whole facility.
Understand what matters.

Connect sensors, asset information and engineering interpretation. Explore a developing monitoring approach for industrial and commercial facilities through the interactive demonstrations below.

POWER · ASSETS · INTELLIGENCE

One facility.
One connected picture.

THE COMPLETE OPERATING ENVIRONMENT

From the source of power.
To the systems it serves.

Grid. Solar. Generation. UPS. Distribution. Building services. Production.

A facility-wide view. Choose a stage to explore.Discuss your facility ↗

Illustrative experience, not a live monitoring service. Coverage is scoped to installed meters, available controls, protocols and data access. Existing specialist controls retain their role.

MEASUREMENTS & ENGINEERING DETAILExplore sensors, network examples and the evidence+

WHY ANALYTICS NEEDS ACTION

Find the issue.
Close the loop.

Measurements become useful when someone investigates, implements a change and checks the result. AI-assisted analysis helps focus that work; an engineer validates the cause and response.

Explore electrical losses and stress ↗

02 / ENERGY & ASSET INTELLIGENCE

Your facility has a story.
Make the signals visible.

Know where energy goes.
Understand what is changing.
Decide what to investigate next.

Missing drawings. Fragmented records. Consumption that is difficult to explain. Start by connecting the physical facility to a structured view of its assets and operating data.

Our monitoring approach combines measurement, recorded history and engineering interpretation. Explore the concept below—from a sensor on the equipment to the decision it supports.

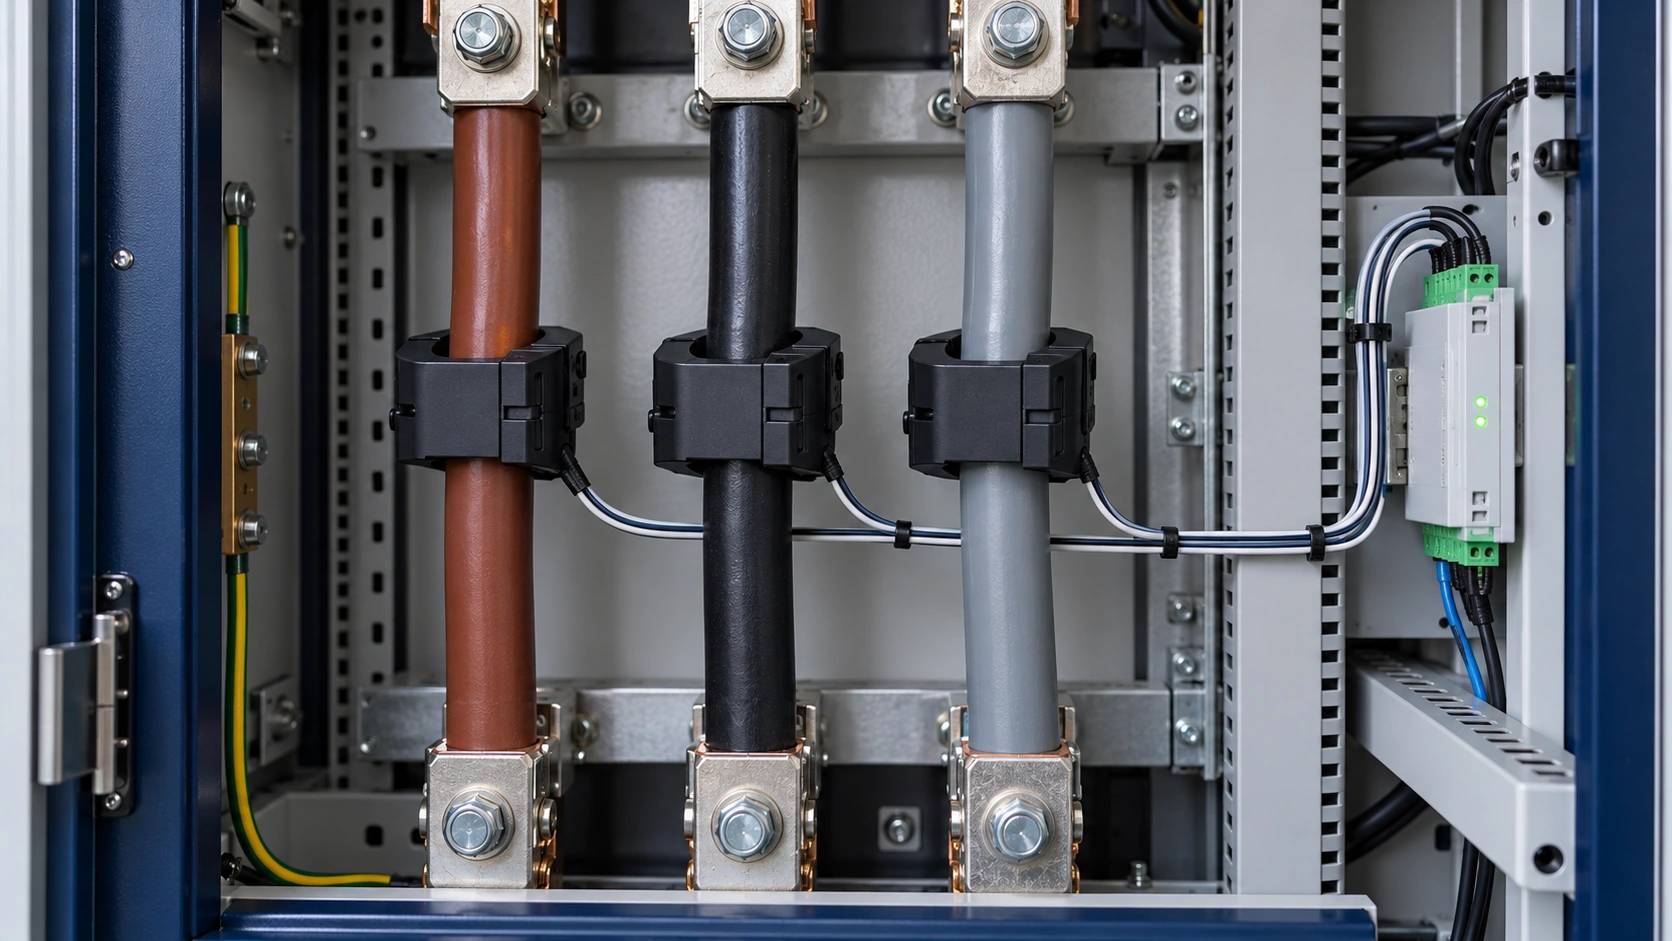
Generic current clamps on three individual phase conductorsEQUIPMENT CONCEPT

THE MEASUREMENT LAYER

Start at the source.

Current sensing reveals operating patterns at individual feeders. Suitable voltage measurements and a power analyzer add a fuller picture of electrical demand.

Measure→Record→Understand
Explore four measurement points with realistic concept close-ups.

TRY A CHANGE IN OPERATING CONDITIONS

What would you notice?

INTERACTIVE DEMO · SIMULATED DATA
Active & reactive power
● kW● kvar

12 synthetic hourly averages · 06:00–18:00

THE ENGINEERING QUESTION

THE BIGGER PICTURE

Reconnect the drawings.
The assets. The data.

Build an electrical-network view from available records and site verification. Connect measurements to the right equipment, retain its history and make the system easier to understand.

ILLUSTRATIVE DATA

An interactive preview of our developing monitoring offering. Measurements and alerts are simulated. Predictive studies require a validated model and suitable site data.

LET’S TALK ABOUT YOUR NEXT STEP

What would better visibility
help you decide?

Start with the equipment, energy use or operating question you want to understand.

Start a conversation ↗

100%

VOLTANOR / INDUSTRIES

Inside the production line

All systems
Complete production line
100%Open full-size image ↗

Click a marker · Drag to pan · Pinch or scroll to zoom

Representative equipment illustrations. Detail views show the system type; they are not exact crops or a measured layout of one facility.

VOLTANOR / INTERACTIVE EXPERIENCE

From the plant to the insight.

Preparing the monitoring experience…

VOLTANOR

Privacy & this website

This version runs without analytics, advertising cookies, user accounts or a contact-form database. Your interaction with the demonstrations stays in your browser.

The enquiry form prepares an email using your own email application. The page does not send or store the enquiry. Your email provider handles the message when you choose to send it.

For questions, contact sales@voltanor.net.